*Note: New neighborhood crime statistics include both 2023 and 2022. Updated February 2024.
The City of St. Louis offers an eclectic and colorful choice of both trendy and family-friendly neighborhoods with a variety of entertainment and hospitality venues, restaurants, and a growing diversity of skilled employment opportunities. St. Louis has experienced a transforming resurgence over the last two decades, establishing itself as a great destination for tourists, foodies, sports fanatics, musicians, entrepreneurs and national conventions.
Over the last two decades local civic leaders, lawmakers, business owners, developers and financial investors have worked diligently to reshape St. Louis’ image from a conservative, flyover metropolis into an alluring mecca for innovative startups, high-tech trailblazers, business entrepreneurs, culinary creators, musicians and artists.
Forbes magazine ranked St. Louis 2nd in the country as an “emerging business start-up destination.”
In 2021, Time magazine selected St. Louis as one of the World’s Greatest Places for “new and exciting experiences.”
St. Louis’s reputation as a formidable agribusiness (Donald Danforth Plant Science Center), geospatial technology center (National Geospatial-Intelligence Agency), pharmaceutical research and manufacturing leader (Bayer, Mallinckrodt, Pfizer, Sigma Millipore), and ground-breaking medical research hub (Washington University & BJC Institute of Health, St. Louis University) attracts top talent from around the world.
More Reasons to Love and Live in St. Louis
- Diverse and vibrant music scene.
- Variety of restaurants and ethnic foods, cool bars and “old city taverns.”
- Comparatively modest cost of living.
- Renowned life-science research universities.
- Award-winning, family-owned Italian restaurants to rival New York City’s Little Italy.
- Gorgeous historic residential neighborhoods, converted factory luxury lofts and funky business districts.
- The baseball Cardinals, second only to the Yankees in World Series titles; Blues hockey, Billikens basketball and wildly popular St. Louis City SC soccer club.
- Free general entrance into the St. Louis Art Museum, Missouri History Museum, St. Louis Zoo, and the St. Louis Science Center.
- Sprawling Forest Park, 500 acres larger than NYC’s famed Central Park.
- And of course, the piece de resistance, Chuck Berry, the proud Father of Rock ‘n Roll and inspiration to millions. Long before he duckwalked on American Bandstand, Berry scuffed his shoes on the streets of the Ville neighborhood in North St. Louis City.
Undeniably, an impressive list of fun things to do in St. Louis and great reasons to visit or put down roots.
That said, St. Louis also has a bruised public image attributable to the city’s increasingly high-profile reputation as a dangerous and violent city to live in or visit.
For instance, a 2022 survey by WalletHub.com made big headlines (below) when it announced St. Louis the Least Safe City in America and ranking it at the very bottom of their list of 182 U.S. cities. The New York Post and countless national and international news-starved media organizations eagerly reposted the embarrassing (and misleading) headline.

Interestingly enough though, a similar quality-of-life study conducted by U.S. News and World Report ranked St. Louis as far down as 23rd on their list of the “Most Dangerous Places in the U.S. 2022-23.”

“We have a real crime problem, and we have a crime perception problem,” Richard Rosenfeld, criminologist at the University of Missouri-St. Louis.
So which is true? Does St. Louis suffer from an undeserved reputation as being violent and dangerous?
This is not a unique question. In fact, some quick online research brings up a list of popular Google searches inquiring about crime and safety in St. Louis.
These are actual Google searches: “how safe is St. Louis,” “best St. Louis neighborhoods for families,” “safest neighborhoods in St. Louis,” “is downtown St. Louis safe,” “safest areas to live in St. Louis,” “St Louis crime rate” and “St. Louis murder rate 2022.”
Not exactly tourist-friendly bumper sticker slogans endorsed by city hall or the local chamber.
So, in order to satisfy the public’s obvious curiosity about what they should expect when visiting or living in St. Louis, we have performed extensive research to help answer the #1 Google search query about St. Louis:
Is St. Louis a Safe Place to Live or Visit?
Despite the screaming headlines crowning St. Louis the most dangerous and violent place to visit or live in America, based in large part on skewed crime and murder rate statistics, the St. Louis metro area, meaning St. Louis City and surrounding St. Louis County combined, actually has a “respectable” crime rate and murder rate, compared with other U.S. cities comparable in population. See murder rates for U.S. cities, below.
So why does “St. Louis” consistently rank in the nation’s Top-5 on virtually every list of most dangerous U.S. cities with one of the highest violent crime rates and murder rates?
Good question. When these types of crime rates are reported in news articles or quality-of-life studies and surveys, or plastered on real estate and travel blogs, the crime and murder rates quoted are attributed to “St. Louis” as a whole, but the crime rates and statistics quoted are virtually always for St. Louis City alone and not St. Louis County.
So the public perception is that the entire St. Louis Metrop0litan area has an alarmingly high crime rate. But in actuality, St. Louis County’s (the suburbs) crime rate is much, much lower than St. Louis City’s crime rate. If they combined, as they are in most other metropolitan areas across the country, the quoted crime rates would be much lower. Why? We’ll unlock this secret in just a bit. Patience.
Year-over-year comparison of the number of murders, assaults and motor vehicle thefts in the City of St. Louis between 2019 and 2022.
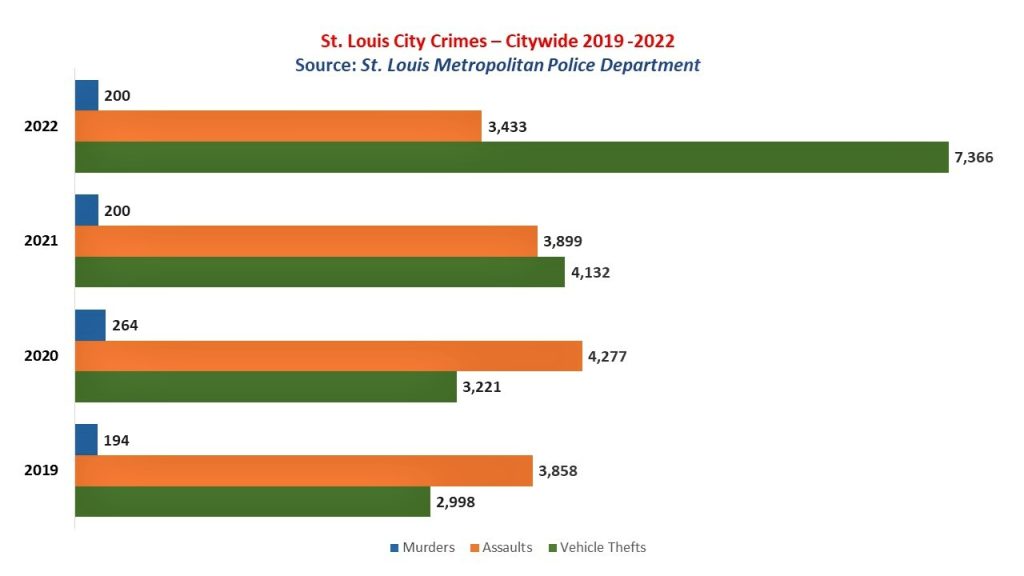
Assaults have actually dropped since 2019, but vehicle thefts, as in most cities across the country, have skyrocketed.
St. Louis’s Unique Geographical Structure is Key to its Often Publicized Crime Rates
To understand why “St. Louis” crime rates can be misrepresentative, and therefore generating bad public relations for St. Louis as a whole, it helps to understand how St. Louis is physically structured.
St. Louis City and St. Louis County are NOT one entity. They are divided, separating in 1876 at the behest of the City, NOT the County. The resulting consequence being that each exists as its own geographical area, with two separate governments, operating two separate police departments (actually, multiple police departments), which subsequently tabulate two separate crime statistics data bases.
Why is this important? It has to do with population. See more below.
The City is comprised of 79 individual neighborhoods – the surrounding County area, which includes St. Louis County and a scattered collection of 91 individual municipalities – most of which operate their own local municipal governments and police departments. Compared to other U.S. cities, this is a unique arrangement and can be a little confusing for not only newcomers, but even locals, so don’t feel bad if your head is spinning.
The resulting less than spectacular public image “St. Louis” suffers from – St. Louis is One of the Most Dangerous Cities in the U.S. with the Highest Murder Rate – can largely be attributed to the much publicized crime rates and murder rates only within the less populated City, NOT the more densely populated County, and NOT the City and County combined. Most people are not aware of this, including lazy blog writers who don’t do their homework but opt instead to lazily copy and paste widely circulated misleading statistics they find on the internet, which were posted by other lazy writers who haven’t done their homework either.

A geographical area’s population is the key factor in how crime rates are calculated, based on a per-capita math equation: the number of individual crime incidents divided by population size, typically on a per 100,000 (residents) scale. Which, as in the case of St. Louis City, with a comparatively much smaller population than its St. Louis County counterpart, but also with a higher individual crime incident count, translates into a high crime rate.
Population is the Key
According to the St. Louis Metropolitan Police Department’s annual crime report for 2022, St. Louis City proper, not the City and County combined, reported 200 homicides. Measured against the City’s relatively small population of 293,310, results in a murder rate of 68.18. This is the frighteningly high murder rate splashed across the internet.
St. Louis County, on the other hand, recorded less than half that number of murders in 2022, 92. And with a population three times that of the City, 997,187, St. Louis County’s murder rate was only 9.22 in 2022. One of the lowest anywhere in the country.
What does this mean? If both St. Louis City and St. Louis County homicide numbers, and populations, were combined, (292 murders, 1,290,497 population), representing “St. Louis” as a whole, then the murder rate for “St. Louis” would have been a “respectable” 22.63 in 2022, three times lower than the City’s homicide rate alone.
 But the general public is not aware of this skewed math equation, and so the glaring 68.18 murder rate of St. Louis City alone is what grabs all the headlines and is responsible for St. Louis’ top-tier ranking as one of the most violent cities in the U.S. This ridiculously high murder rate even makes “St. Louis” competitive on a global scale, ranking in the Top-10 or Top-15 of most violent cities in the entire world. And the competition at this level is serious, with some major players: Tijuana, Mexico (138 murder rate) and Cape Town, South Africa (66.36 murder rate). Worthy adversaries, no doubt.
St. Louis Murder Rate Compared to Other U.S. Cities
Now let’s take the recalculated combined murder rate of St. Louis City and St. Louis County, 22.63, and compare it to other U.S. cities similar in size.
- Indianapolis: pop. 882,039; 211 homicides (23.92 murder rate)
- Dallas: pop. 1,288,457; 214 homicides (16.60 murder rate)
- Philadelphia: pop. 1,576,251; 516 homicides (32.73 murder rate)
- St. Louis: pop. 1,290,497; 292 homicides (22.63 murder rate)
Suddenly, “St. Louis” doesn’t look so bad.
Top Five U.S. Cities with the Highest Number of Murders in 2022
#1. Chicago, IL: 697
#2 Philadelphia, PA.: 516
#3 New York, NY.: 438
#4 Houston, TX.: 435
#5 Los Angeles, CA.: 382
Did You Know? By individual homicide count, the City of St. Louis ranked 16th in the country in 2022.
So does this mean St. Louis does not have a crime problem?
As you can see by the 2022 St. Louis City violent crimes and property crimes statistics below, the answer is clearly, NO.
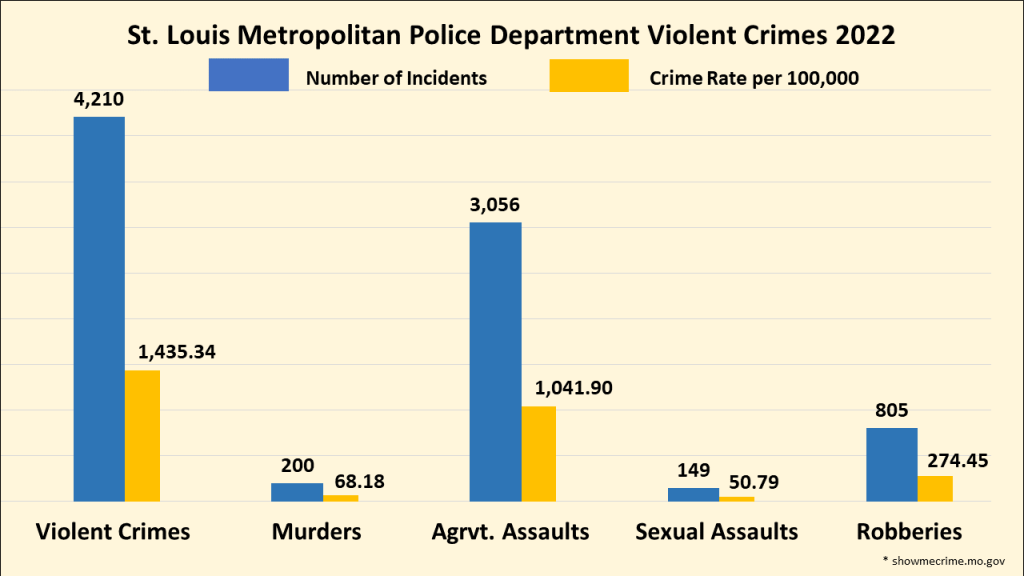
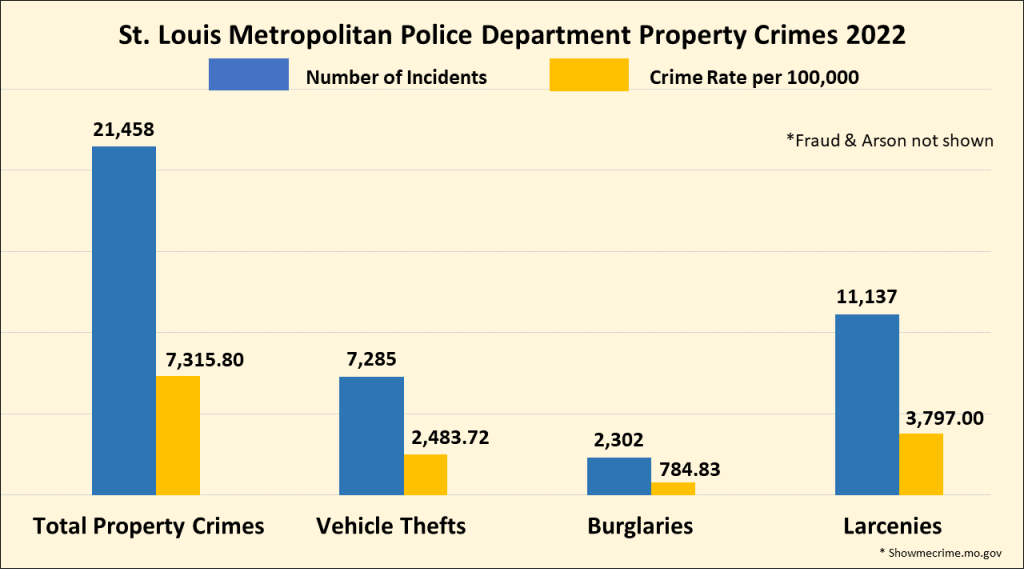
It is obvious looking at the numbers above that St. Louis City is no Disneyland, and everyone (except the criminals) agrees that the City of St Louis does have a very serious crime problem. And, the crime has increasingly spread into the surrounding St. Louis County area.
What Areas of St. Louis are Safe to Live in or Visit?
Having established that St. Louis City is statistically more dangerous than St. Louis County, let’s explore in more detail the safe and dangerous areas of St. Louis City and its neighborhoods.

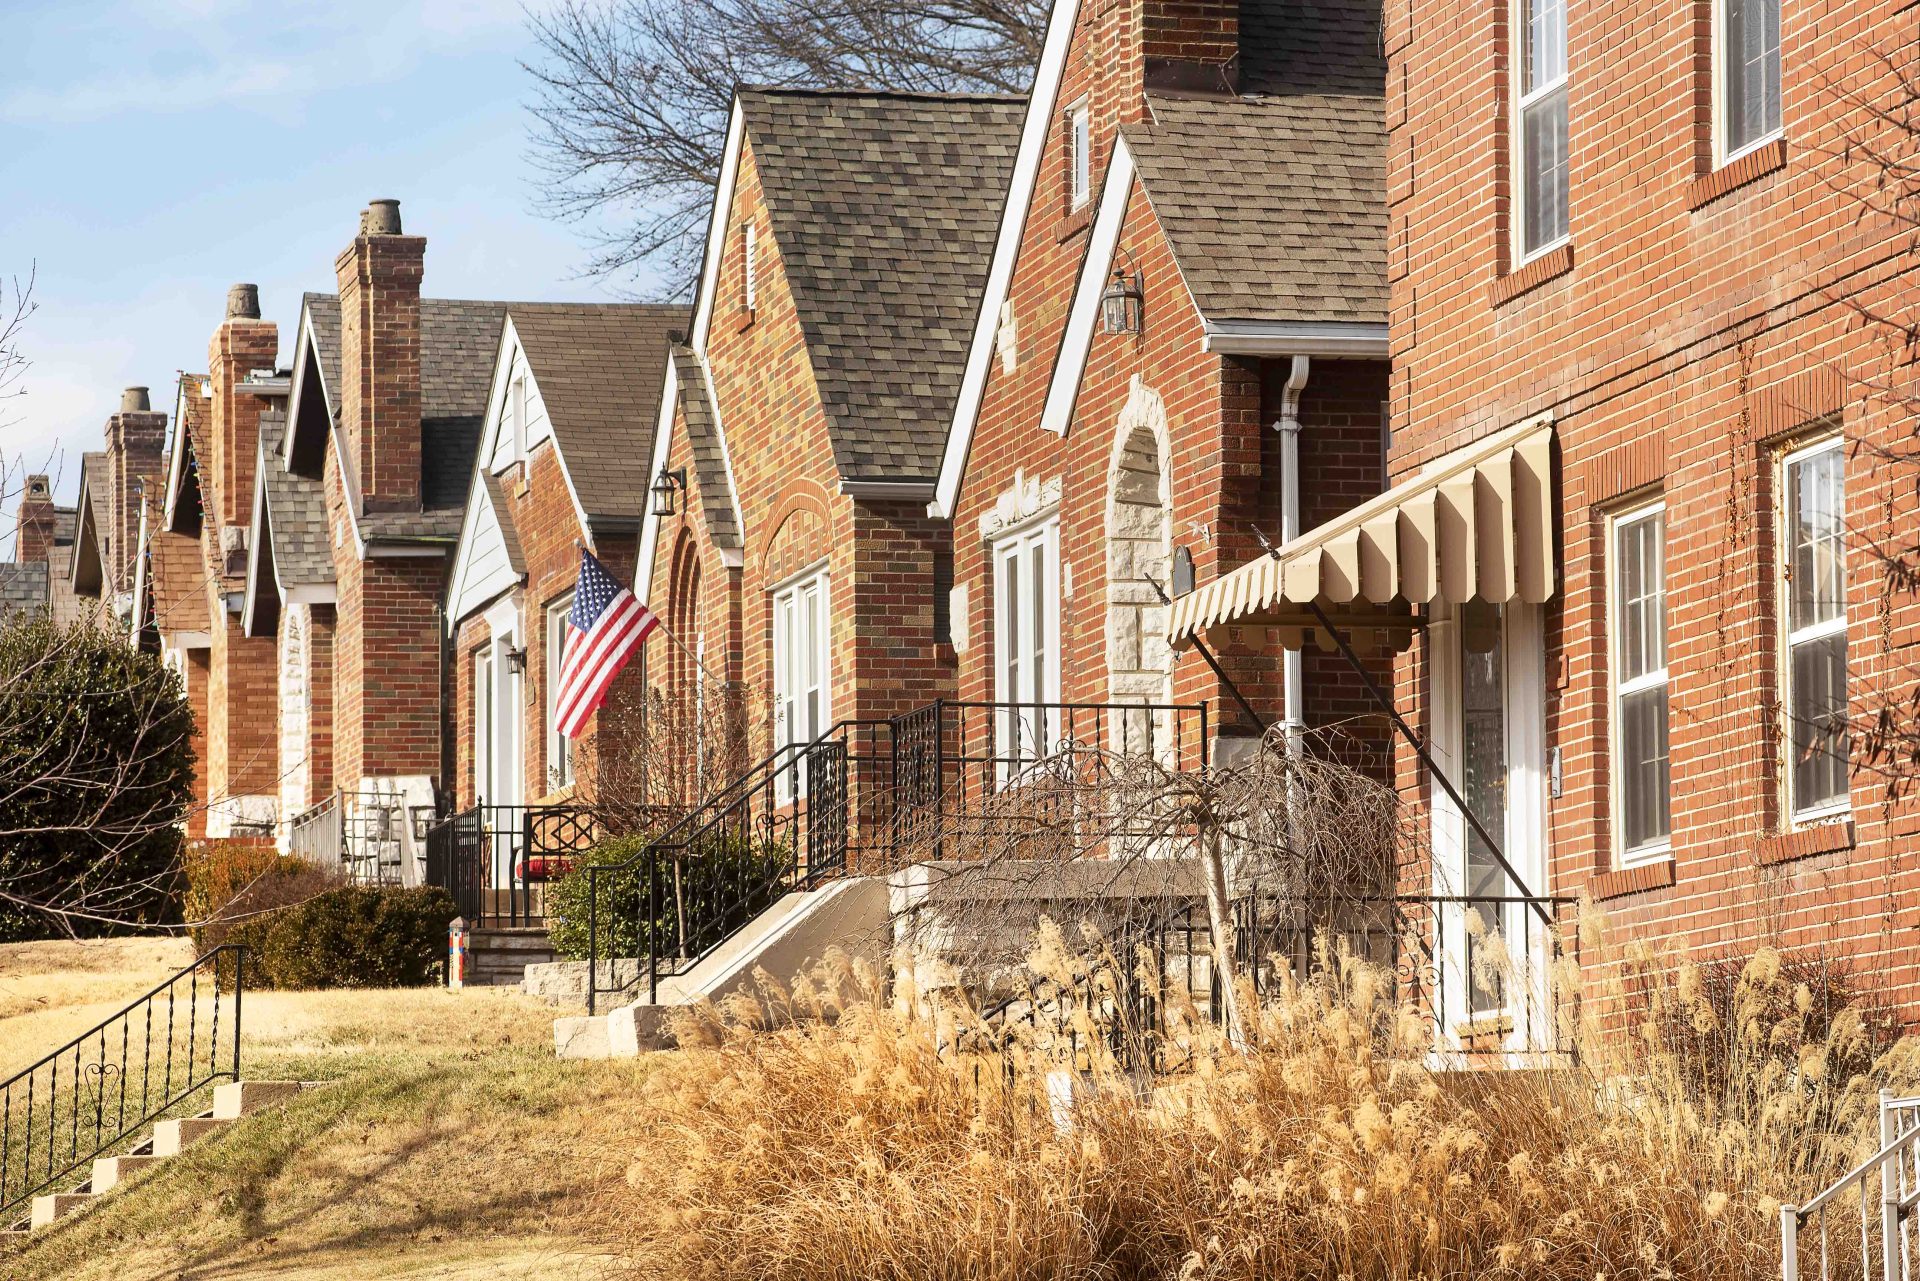
Despite the high crime volume in specific neighborhoods in the City of St. Louis, many of the 79 individual neighborhoods remain predominantly safe for families, young couples and empty nesters, and they offer more of a city-like vibe than St. Louis County municipalities. And St. Louis City neighborhoods are rich with independently-owned retail stores and restaurants for locals and tourists to explore, eat, shop and work.
Interestingly enough, even within what are commonly considered the most dangerous neighborhoods in the City of St. Louis, there are “hidden” gems popular with locals and tourists. One being the historic “retro” confectionary and café Crown Candy Kitchen, established in 1919. One of St. Louis’ more popular local landmarks, Crown Candy has not budged from its original location at the corner of St. Louis Ave. and 14th St., in North St. Louis, a high-crime neighborhood originally populated mostly by German immigrants in the 1800s.
BIG PICTURE
To be completely candid and transparent, it is important to note that St. Louis City is the kind of place where vigilance is your best friend, and in some areas of town, a simple matter of survival. It has been noted by many locals and visitors that they feel safer walking the streets of Chicago (with four times the number of murders) than St. Louis because of Chicago’s dense population and the sidewalks and parks crowded with people even in the late-night hours.
This observation is exactly why one of the critical factors for the continued rebirth of the City of St. Louis is encouraging and continuing the influx of new businesses, more public venues, and more residents and visitors. It is also critical though to have better security for people and businesses to keep people in the downtown area and stop running for the safe sanctuary of the suburbs.
People often feel vulnerable, and for good reason, walking Downtown St. Louis streets because the sidewalks are not crowed with people, and a person may find themselves turning a corner and suddenly walking down an isolated street and confronted with two or three rather suspicious looking characters hanging out and just waiting for an opportunity. This is a fact of life in St. Louis. Anyone, tourist or local, walking the streets in Downtown St. Louis will undoubtedly get hit up for spare change or cigarettes just walking a few blocks from a parking lot or hotel to Busch Stadium or the Enterprise Center to catch a Cardinals or Blues game, respectively. These scenarios are uncomfortable and troublesome enough for men, but females and families are particularly vulnerable.
Crime in St. Louis Becoming More Widespread
Historically, the majority of violent crimes have been disproportionately concentrated within Northside city neighborhoods. But random pockets in some southside and westside city neighborhoods have also experienced their share of crime. Tower Grove Park itself developed a dangerous reputation in the 70s. Even Forest Park became a haven for crime in the 70s, driving away many tourists and locals. Fortunately, that has changed and Forest Park has experienced a lifestyle resurgence over the last two decades thanks to the Herculean efforts of the Friends of Forest Park nonprofit, countless other organizations, the city, and millions of dollars poured into the park to create a more natural flowing native landscape, and improving amenities such as jogging, walking and bicycling paths and other things to attract a broader populace. The expansion of Washington University, flanking the west end of the park along Skinker Blvd., is responsible for a growing influx of students from around the world, many even putting down roots in St. Louis upon graduation.
The near Northside, mentioned earlier, is no longer the only area of St. Louis City prone to chronic violent and property crimes. Over the last 5-10 years high levels of crime have spread throughout many areas of downtown, even the core business district, around the the Old Courthouse and the Arch, and south into historic Soulard and the Tower Grove and Shaw neighborhoods, in addition to Dutchtown and others.
Referencing the St. Louis Neighborhood Map above, again, generally speaking, St. Louis City neighborhoods located in the Central, Western and Southwestern corridors are considered very safe to reasonably safe to live in and visit: North Hampton, St. Louis Hills, Tamm-Clayton, Skinker-Wydown, Lindenwood Park, Hi-Pointe, among others, are at the top of the list.
There are exceptions though even in these areas of the City, the Central West End (CWE) near Forest Park being one of them. Recognized as one of the nicest and most vibrant areas of St. Louis City, with a mix of two-bedroom brick homes, multi-family flats, historic Victorian-style mansions, high-rise apartments, art galleries and numerous upper-scale but casual sidewalk cafes, the CWE draws big crowds, which means it also draws a lot of criminals.
The result being, in 2022 the CWE ranked #4 in total crime volume out of all 79 St. Louis City neighborhoods. In addition, the St. Louis Metropolitan Police Department reported 430 motor vehicle thefts, ranking the Central West End #1 in stolen vehicles out of the entire city.
Did You Know? The St. Louis Metropolitan Police Department reported 691 stolen motor vehicles in the City of St. Louis, solely in the month of January 2023. That, compared to 311 stolen vehicles during the same month in 2022. In just one week in January, 149 vehicles were stolen!
Commercial Access Control Systems for Your Business

Schedule a FREE On-Site Security Evaluation Today!
MO: 314-241-0422 IL: 618-394-1144 or Email Us
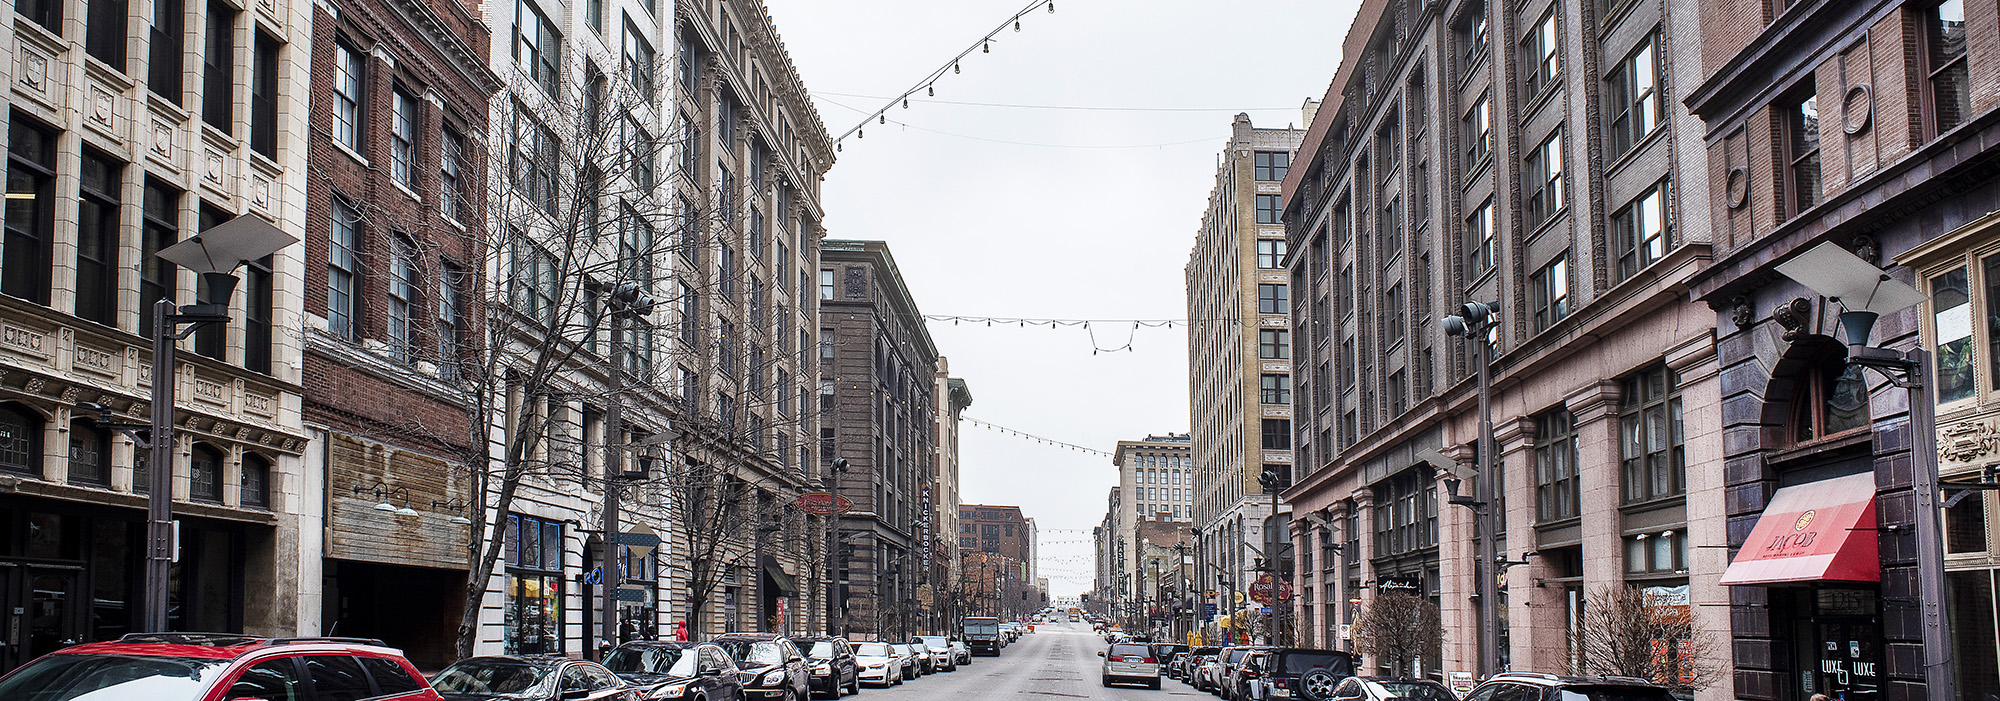
DOWNTOWN For the past 25 years many individuals, businesses, civic leaders and betterment organizations have been working diligently to improve the quality of life in the City of St. Louis. This includes the investment of millions of dollars into the renovation and transformation of old factories and hotels, transforming them into luxury lofts, condos and businesses. This included the construction of new multifamily, mixed-used complexes, and a proposal to transform the long-neglected industrial area south of the Gateway Arch, between the river and S. Broadway, into a high-end residential and commercial mixed-use complex.
The addition of the National Blues Museum on Washington Avenue, movie theater and over two dozen restaurants and nightclubs, give locals and tourists even more reason to venture Downtown and experience that city lifestyle. The expansion of Ballpark Village next to Busch Stadium includes a number of new restaurants and high-rise condos overlooking the ballpark. Improvements made to Kiener Plaza Park, the addition of City Garden, renovations to the Gateway Arch grounds and the Old Courthouse have put a fresh face on the City in an attempt to attract more visitors, residents, conventions, special events and new businesses.
Crime and Downtown St. Louis
But despite all these transforming improvements, downtown St. Louis is still being held back from reaching its full potential, primarily due to the intensifying criminal activity on the streets.
St. Louis City business owners and residents are frustrated and fed up. Many have taken to he media and online vocalizing their frustrations, while other former city boasters simply moved out of the city to higher, safer ground. The St. Louis Metropolitan Police Department has suffered from low morale and low pay for years, and has been criticized for being largely ineffectual in stopping crime. Additionally, many business owners, residents and civic leaders continue to openly express their frustrations with city hall and Mayor Tishaura Jones for not supporting city police officers, highlighting the mayor’s police officer hiring freeze in 2021, and publicly criticizing police department tactics.
The amount of crime in Downtown St. Louis is out of control and dramatically increased during the pandemic. Crime numbers have begun to fall, but there are still major crime issues that need to be addressed.
Downtown St. Louis now ranks #1 in crime volume among all St. Louis City neighborhoods. In 2022, downtown St. Louis crime level was seven times higher than the quiet St. Louis Hills on the outer edge of the city’s SW border.
Downtown West, home to the new CITYPARK soccer stadium and St. Louis Aquarium at St. Louis Union Station, ranks #2 in total crime volume. Fortunately, developers and entrepreneurs are trying to turn this around with the building of new multi-family housing, renovating existing historic housing developments, and new businesses moving into the area eager to be a part of Downtown West’s hopeful resurgence leveraged by the new CITYPARK stadium and influx of thousands of soccer fans on game days. The infusion of money into this area of the city every time St. Louis City SC takes the field is incalculable.
Did you Know? The City of St. Louis has 108 public parks. Forest Park being the largest with approximately 1,325 acres and draws 12 million visitors a year.
SOUTH CITY Shifting away from the Downtown area, South St. Louis City has many unique offerings of its own. Case in point, The Hill neighborhood, a modest, tightly-knit Italian community with plenty of family-owned bakeries, Italian food markets, shops and some of the best Italian restaurants in the country. The is the same working-class neighborhood that gave birth to the Yankees’ “It ain’t over till it’s over” Yogi Berra and the Cardinals’ Joe Garagiola.
Just a few blocks from The Hill is the Missouri Botanical Garden and Tower Grove Park, adjacent to the historic Shaw, Tower Grove East and Tower Grove South neighborhoods. Another area of St. Louis City that has experienced a positive transformation in recent years with the launch of new trendy ethnic restaurants, bars and shops. All of which has succeeded in attracting lots of visitors and new residents, which in turn, has also attracted hoodlums responsible for the spike in shootings, assaults, robberies, drug activity and stolen vehicles over the last several years.
Thieves have become so embolden they are now putting resident’s cars up on blocks and stealing all four tires and rims while the car in parked in the homeowner’s driveway. What can you say, it’s city living.
Other South City neighborhoods increasingly being ravished by crime include Dutchtown, Carondelet and Bevo Mill. Once stable, working-class communities, now they’re being overtaken by criminals, forcing out decent tax paying residents who are tired of being victims and ignored by city hall and the police.
Did you Know? Based on population percentage, St. Louis City ranks 8th on the list of U.S. cities with the highest number of millionaires.
Which brings us to the other side of St. Louis City, the upper-scale exclusive neighborhoods featuring early-20th and late-19th-century handcrafted, three-story homes and clusters of stone-pillared mansions lining picturesque streets in semi-private neighborhoods. The Forest Park area and Central West End are prime examples, along with Lafayette Square, Wydown-Skinker, Benton Place, among others.
As mentioned before though, these neighborhoods are not without crime, and ironically, many of them border the poorest neighborhoods where crime is a way of daily life.
Did you Know? 20% of St. Louis City residents live below the poverty level. Down from 27% between 2010-2014.
NORTH CITY North St. Louis City is only a short car ride from many of the richer St. Louis City neighborhoods, but it might as well be lightyears away. Many areas of the Northside, as locals collectively refer to struggling neighborhoods like Hyde Park, Carr Square, St. Louis Place, Jeff-Vander-Lou, O’Fallon, Kingsway East, among others, is akin to a survivalist training ground. Devastated by decades of poverty, neglect and vandalism, this area of St. Louis City has the highest concentration of violent crimes, including murders, rampant drug activity and assaults.
Driving along Martin Luther King Drive and St. Louis Avenue in North City is like traveling through a third-world country, passing block after block of crumbling brick homes, boarded-up businesses clad in chain link fencing and acres of trash-strewn, weed-choked vacant lots.
Did You Know? The City of St. Louis has 10,039 vacant homes and businesses and 14,309 neglected vacant lots. (STL Vacancy Collaboration).
St. Louis Neighborhood Crime Ranking Methodology
It is important to note that all crime numbers listed below for St. Louis Neighborhoods are official St. Louis Metropolitan Police Department crime statistics. It is also important to note that our ranking method was NOT based on neighborhood crime rates, but on crime volume, the actual number of individual crime incidents recorded by the St. Louis Metropolitan Police Department for 2022.
The reason for this was to help illustrate exactly how much actual crime took place in each neighborhood listed below. Since crime “rates” can be hard to grasp and visualize, for all the reasons mentioned earlier, we thought crime incident volume really told a better story about each neighborhood.
But to satisfy those who prefer rates, we have included two primary crime rate statistics for each St. Louis City neighborhood—murders and total crimes (personal and property combined). These rates are based on per a capita population scale of 100,000.
Stop Crime in Real Time
24-Hour LIVE Outdoor Perimeter Security Camera Monitoring

Professional Security Camera Installation & Service
What is the Difference Between Crime Volume and Crime Rate?
You will quickly notice that crime rates do not match crime volume. This is because, as discussed above, crime rates are dependent on the size of the population being measured.
For instance, Old North St. Louis recorded 1 murder in 2022, and 514 total crimes (violent and property). Measured against its relatively small population of 1,488, Old North St. Louis posted a total crime rate of 345.43 (murder rate, 0.67), using a 1,000 per capita calculation, not 100,000. This will be explained further below.
On the other hand, the Kingsway East neighborhood recorded far more murders than Old North St. Louis, or any other St. Louis City neighborhood for that matter, with 12 murders in 2022. (Baden, Dutchtown and Wells-Goodfellow recorded 10 homicides each.) But because Kingsway East also had a similar number of total crimes reported, 591, and that number measured against a higher residential population of 2,502 , the total crime rate (not murder rate) was 236.21, ten points lower than Old North St. Louis. This, even though total crime incidents in Kingsway East was almost identical to Old North St. Louis. (Kingsway East’s murder rate was 4.79). Again, using a 1,000 per capita calculation.
Add to the equation that both these neighborhoods are almost identical in geographical size: Kingsway East is o.49 square miles, Old North St. Louis 0.39 square miles. Only one-tenth of a square mile difference.
You can see how crime rates can be manipulated and reported to one’s disadvantage or one’s advantage. Rates can be fuzzy and fudged in either direction. If you only look at Kingsway East’s total crime rate, you might think it is a safer neighborhood to live in. But considering 12 murders were reported in the Kingsway East neighborhood and only 1 in the Old North St. Louis neighborhood, which neighborhood would you rather live in and which would you avoid?
To get the full picture though, you would really need to closely examine each police report and study the circumstances from all sides. Numbers can be a helpful guide, but they don’t tell the whole story.
Other Factors Negatively Affecting St. Louis Neighborhood Crime Rates
The randomness of crimes, including murders, also plays a factor when determining how safe or dangerous a St. Louis City neighborhood may be. Even though murder rates are based on a measurement involving the local neighborhood’s permanent residential population size, a large percentage of murders are transient in nature: the victim is often from a different neighborhood and so is the killer. They were both just “passing through,” but the police report places the scene of the crime in the particular neighborhood the actual murder occurred in. So regardless of the circumstances of the murder, each one is attributed to the neighborhood in which it took place.
Poorer neighborhoods can be a breading ground for crime for a variety of reasons: Chronic poverty, lack of jobs, minimal upward personal growth opportunities, lower education levels, absence of two-parent households or lack of parental oversite, lack of community bonding and outreach, vacant houses, rampant drug usage and drug dealing, easily obtainable firearms, peer pressure, a negative perception of self, as well as false entitlement and a lack of respect for other people’s property and the value of human life. These can all help drive crime activity.
The amount of foot and automobile traffic in a particular neighborhood can also play a major role. Some neighborhoods have more liquor stores, gas stations and late-night fast food restaurants, and these establishments often attract the criminal element more than neighborhoods primarily with residential housing.
Another example is the incredibly high volume of vehicle thefts in Downtown St. Louis compared to its low residential population. But the high influx of cars and trucks in the city during sporting and musical events, people going clubbing and to restaurants, results in more parked cars and more opportunities for thieves.
Many Crimes Go Unreported
Lastly, it is critical to note that according to Statisica.com, it is estimated that only 45.6% of ALL violent crimes were reported to police in the U.S. in 2021. It is also estimated that only 21.5% of ALL sexual assaults were reported. An important and unfortunate distinction because sexual assaults on women still carry the same humiliating personal stigma they have for generations, which means that woman are still very reluctant to put their names in the public record.
There is no way of knowing the exact percentage of crimes that go unreported in the City of St. Louis each year, but based on the percentages above, it is clear that a large number of crimes never make it on a police report.
The time has finally come to unveil the list of Most Dangerous and Safest St. Louis City Neighborhoods.
Top 10 lists of Safest and Most Dangerous St. Louis City Neighborhoods in 2023
The crime statistics below represent 12 individual crime categories pulled from approximately 52 that are tracked in each St. Louis City neighborhood by the St. Louis Metropolitan Police Department and published in their annual crime reports. It’s important to note that some of these crimes can overlap, meaning, one individual person may have been the victim of more than one crime within a single occurrence: e.g., a personal assault, robbery and carjacking, all at the same time. This means that the number of crimes does not necessarily match the number of crime victims on a one-to-one ratio.
These crime numbers represent the total number of individual crimes by volume as categorized by law enforcement, not the crime rate. These are only the crimes that were actually reported to the police in that particular St. Louis City neighborhood. The Murder Rates you see (in parenthesis) are based on a per capita of 1,000, NOT 100,000, because our intent was to compare neighborhood to neighborhood. A 100,000 per capita scale would have been used if we were comparing crimes in each neighborhood to the entire city as a whole.
A few interesting updates to note: The popular Soulard neighborhood missed ranking 10th in the Most Dangerous Neighborhood list by less than 100 crimes. The Greater Ville neighborhood was bumped off that same list by Gravois Park, ranking 10th.
On the Safest Neighborhood list, the Academy neighborhood in North St. Louis City ranks 6th this year and Benton Park 7th. And no longer on the Safest Neighborhood Top 10 list are: Southwest Garden, Lindenwood Park and Northampton neighborhoods.
Top Ten Most Dangerous St. Louis Neighborhoods
Ranked in descending order, starting with the most dangerous St. Louis neighborhood. For the year-over-year change, reference the 2022 stats in parenthesis.
DOWNTOWN
Population: 5,442
- Murders 5 Murder rate: 0.91
- Assaults 403
- Sexual Assaults 22
- Carjackings 9
- Motor Vehicle Theft 233
- Theft FROM Vehicle 294
- Motor Vehicle Theft Parts/Accessories 57
- Burglaries/Breaking & Entering 77
- Property Vandalism 544
- Weapons Violation 123
- Robbery 36
- Drugs/Narcotics 55
Total Person Crimes: 485 (469)
Total Property Crimes: 1,622 (2,727)
Total Society Crimes: 641 (734)
Total Unspecified Crimes: 497 (504)
TOTAL REPORTED CRIMES: 3,245 (4,434)
CENTRAL WEST END
Population: 16,670 *moved up from third to second position in 2023.
- Murders 4 Murder rate: 0.23
- Assaults 235
- Sexual Assault 13
- Carjackings 2
- Motor Vehicle Theft 373
- Theft From Vehicle 411
- Motor Vehicle Theft Parts/Accessories 106
- Burglaries/Breaking & Entering 109
- Property Vandalism 700
- Weapons Violation 73
- Robbery 28
- Drugs/Narcotics 22
Total Person Crimes: 290 (302)
Total Property Crimes: 2,093 (2,089)
Total Society Crimes: 222 (174)
Unspecified Crimes: 315 (250)
TOTAL REPORTED CRIMES: 2,920 (2,815)
DOWNTOWN WEST
Population: 5,115
- Murders 1 Murder rate: 0.19
- Assaults 275
- Sexual Assaults 11
- Cajackings 3
- Motor Vehicle Theft 257
- Theft FROM Vehicle 449
- Motor Vehicle Theft Parts/Accessories 63
- Burglaries / Breaking & Entering 39
- Property Vandalism 669
- Weapons Violation 139
- Robbery 37
- Drugs/Narcotics 40
Total Person Crimes: 343 (404)
Total Property Crimes: 1,738 (2,130)
Total Society Crimes: 385 (376)
Unspecified Crimes: 293 (328)
TOTAL REPORTED CRIMES: 2,759 (3,238)
DUTCHTOWN
Population: 15,356
- Murders 10 Murder rate: 0.65
- Assaults 413
- Sexual Assaults 20
- Carjackings 9
- Motor Vehicle Theft 362
- Theft From Vehicle 106
- Motor Vehicle Theft Parts/Accessories 78
- Burglaries/Breaking & Entering 156
- Property Vandalism 369
- Weapons Violation 176
- Robbery 55
- Drugs/Narcotics 84
Total Person Crimes: 509 (421)
Total Property Crimes: 1,400 (1,404)
Total Society Crimes: 426 (427)
Unspecified Crimes: 405 (386)
TOTAL REPORTED CRIMES: 2,740 (2,638)
TOWER GROVE SOUTH
Population: 12,719
- Murders 3 Murder rate: 0.23
- Assaults 156
- Sexual Assaults 13
- Carjackings 5
- Motor Vehicle Theft 235
- Theft From Vehicle 104
- Motor Vehicle Theft Parts/Accessories 84
- Burglaries / Breaking & Entering 89
- Property Vandalism 298
- Weapons Violation 58
- Robbery 24
- Drugs/Narcotics 16
Total Person Crimes: 201 (154)
Total Property Crimes: 1,058 (1,119)
Total Society Crimes: 143 (105)
Unspecified Crimes: 261 (215)
TOTAL REPORTED CRIMES: 1,663 (1,593)
BEVO MILL
Population: 11,941
- Murders 1 Murder rate: 0.08
- Assaults 151
- Sexual Assaults 3
- Carjackings 4
- Motor Vehicle Theft 227
- Theft From Vehicle 107
- Motor Vehicle Theft Parts/Accessories 79
- Burglaries/Breaking & Entering 65
- Property Vandalism 273
- Weapons Violation 58
- Robbery 22
- Drugs/Narcotics 31
Total Person Crimes: 179 (140)
Total Property Crimes: 962 (840)
Total Society Crimes: 186 (179)
Unspecified Crimes: 233 (233)
TOTAL REPORTED CRIMES: 1,560 (1,392)
JEFF VANDER LOU
Population: 4,209
- Murders 7 Murder rate: 1.66
- Assaults 181
- Sexual Assaults 4
- Carjackings 3
- Motor Vehicle Theft 106
- Theft FROM Vehicle 51
- Motor Vehicle Theft Parts/Accessories 32
- Burglaries / Breaking & Entering 48
- Property Vandalism 176
- Weapons Violation 98
- Robbery`24
- Drugs/Narcotics 37
Total Person Crimes: 227 (275)
Total Property Crimes: 590 (554)
Total Society Crimes: 177 (169)
Unspecified Crimes: 196 (223)
TOTAL REPORTED CRIMES: 1,221 (1,315)
BADEN
Population: 5,465
- Murders 7 Murder rate: 1.28
- Assaults 170
- Sexual Assaults 5
- Carjackings 5
- Motor Vehicle Theft 139
- Theft From Vehicle 46
- Motor Vehicle Theft Parts/Accessories 27
- Burglaries/Breaking & Entering 53
- Property Vandalism 159
- Weapons Violation 85
- Robbery 18
- Drugs/Narcotics 29
Total Person Crimes: 206 (213)
Total Property Crimes: 544 (542)
Total Society Crimes: 165 (158)
Unspecified Crimes: 265 (323)
TOTAL REPORTED CRIMES: 1,180 (1,236)
WELLS GOODFELLOW
Population: 4,473
- Murders 7 Murder rate: 1.56
- Assaults 172
- Sexual Assaults 4
- Carjackings 1
- Motor Vehicle Theft 76
- Theft FROM Vehicle 19
- Motor Vehicle Theft Parts/Accessories 14
- Burglaries/Breaking & Entering 47
- Property Vandalism 111
- Weapons Violation 263
- Robbery 12
- Drugs/Narcotics 41
Total Person Crimes: 219 (214)
Total Property Crimes: 358 (435)
Total Society Crimes: 364 (272)
Unspecified Crimes: 204 (236)
TOTAL REPORTED CRIMES: 1,145 (1,157)
GRAVOIS PARK
Population: 4,683
- Murders 9 Murder rate: 1.92
- Assaults: 145
- Sexual Assaults 3
- Carjackings 1
- Motor Vehicle Theft 120
- Theft FROM Vehicle 44
- Motor Vehicle Theft Parts/Accessories 43
- Burglaries/Breaking & Entering 56
- Property Vandalism 176
- Weapons Violation 102
- Robbery 13
- Drugs/Narcotics 27
Total Person Crimes: 185 (179)
Total Property Crimes: 557 (499)
Total Society Crimes: 207 (137)
Unspecified Crimes: 162 (175)
TOTAL REPORTED CRIMES: 1,111 (990)
Top Ten Safest St. Louis Neighborhoods
*There were a select few St. Louis City neighborhoods that actually reported fewer crime incidents in 2022 and 2023 than some of the neighborhoods listed below. But because the population of those particular neighborhoods was such a small sampling due to the neighborhood’s geographical size or because the neighborhood was more commercial than residential, those neighborhoods are not shown here.
Ranked in descending order, starting with the safest St. Louis neighborhood.
Franz Park
Population: 2,260
- Murders 0 Murder rate: 0
- Assaults: 6
- Sexual Assaults 0
- Carjackings 0
- Motor Vehicle Theft 28
- Theft FROM Vehicle 23
- Motor Vehicle Theft Parts/Accessories 3
- Burglaries/Breaking & Entering 10
- Property Vandalism 47
- Weapons Violation 2
- Robbery 0
- Drugs/Narcotics 1
Total Person Crimes: 7 (10)
Total Property Crimes: 140 (161)
Total Society Crimes: 6 (10)
Unspecified Crimes: 20 (23)
TOTAL REPORTED CRIMES: 173 (204)
HI POINTE
Population: 2,151
- Murders 0 Murder rate: 0
- Assaults: 17
- Sexual Assaults 0
- Carjackings 0
- Motor Vehicle Theft 32
- Theft FROM Vehicle 34
- Motor Vehicle Theft Parts/Accessories 7
- Burglaries/Breaking & Entering 1
- Property Vandalism 36
- Weapons Violation 3
- Robbery 2
- Drugs/Narcotics 0
Total Person Crimes: 20 (10)
Total Property Crimes: 139 (192)
Total Society Crimes: 5 (9)
Unspecified Crimes: 52 (48)
TOTAL REPORTED CRIMES: 216 (259)
CLAYTON TAMM
Population: 2,348
- Murders 0 Murder rate: 0
- Assaults 23
- Sexual Assaults 4
- Carjackings 0
- Motor Vehicle Theft 36
- Theft FROM Vehicle 46
- Motor Vehicle Theft Parts/Accessories 6
- Burglaries/Breaking & Entering 4
- Property Vandalism 50
- Weapons Violation 5
- Robbery 1
- Drugs/Narcotics 0
Total Person Crimes: 27 (11)
Total Property Crimes: 162 (201)
Total Society Crimes: 14 (15)
Unspecified Crimes: 21 (24)
TOTAL REPORTED CRIMES: 224 (251)
CLIFTON HEIGHTS
Population: 2,836
- Murders 0 Murder rate: 0
- Assaults 12
- Sexual Assaults 0
- Carjackings 0
- Motor Vehicle Theft 44
- Theft FROM Vehicle 44
- Motor Vehicle Theft Parts/Accessories 9
- Burglaries/Breaking & Entering 12
- Property Vandalism 68
- Weapons Violation 8
- Robbery 2
- Drugs/Narcotics 2
Total Person Crimes: 14 (14)
Total Property Crimes: 199 (232)
Total Society Crimes: 17 (17)
Unspecified Crimes: 54 (46)
TOTAL REPORTED CRIMES: 284 (309)
HOLLY HILLS
Population: 3,647
- Murders 0 Murder rate: 0
- Assaults 16
- Sexual Assaults 2
- Carjackings 0
- Motor Vehicle Theft 42
- Theft FROM Vehicle 10
- Motor Vehicle Theft Parts/Accessories 26
- Burglaries/Breaking & Entering 22
- Property Vandalism 48
- Weapons Violation 10
- Robbery 6
- Drugs/Narcotics 4
Total Person Crimes: 30 (37)
Total Property Crimes: 199 (239)
Total Society Crimes: 31 (37)
Unspecified Crimes: 30 (41)
TOTAL REPORTED CRIMES: 290 (354)
ACADEMY
Population: 2,355
- Murders 0 Murder rate: 0
- Assaults 65
- Sexual Assaults 0
- Carjackings 0
- Motor Vehicle Theft 41
- Theft FROM Vehicle 21
- Motor Vehicle Theft Parts/Accessories 3
- Burglaries/Breaking & Entering 32
- Property Vandalism 52
- Weapons Violation 57
- Robbery 12
- Drugs/Narcotics 16
Total Person Crimes: 74 (137)
Total Property Crimes: 196 (244)
Total Society Crimes: 67 (96)
Unspecified Crimes: 52 (115)
TOTAL REPORTED CRIMES: 389 (592)
BENTON PARK
Population: 3,581
- Murders 0 Murder rate: 0
- Assaults 16
- Sexual Assaults 2
- Carjackings 0
- Motor Vehicle Theft 42
- Theft FROM Vehicle 10
- Motor Vehicle Theft Parts/Accessories 26
- Burglaries/Breaking & Entering 22
- Property Vandalism 48
- Weapons Violation 10
- Robbery 6
- Drugs/Narcotics 4
Total Person Crimes: 39 (39)
Total Property Crimes: 287 (383)
Total Society Crimes: 37 (34)
Unspecified Crimes: 76 (88)
TOTAL REPORTED CRIMES: 439 (544)
ST. LOUIS HILLS
Population: 7,516 *ranked 6th in 2022
- Murders 0 Murder rate: 0
- Assaults 24
- Sexual Assaults 2
- Carjackings 0
- Motor Vehicle Theft 67
- Theft FROM Vehicle 48
- Motor Vehicle Theft Parts/Accessories 37
- Burglaries/Breaking & Entering 18
- Weapons Violation 5
- Robbery 3
- Drugs/Narcotics 4
Total Person Crimes: 38 (25)
Total Property Crimes: 386 (432)
Total Society Crimes: 26 (20)
Unspecified Crimes: 48 (73)
TOTAL REPORTED CRIMES: 498 (560)
PRINCETON HEIGHTS
Population: 7,346
- Murders 0 Murder rate: 0
- Assaults 28
- Sexual Assaults 1
- Carjackings 0
- Motor Vehicle Theft 80
- Theft FROM Vehicle 33
- Motor Vehicle Theft Parts/Accessories 44
- Burglaries/Breaking & Entering 35
- Property Vandalism 89
- Weapons Violation 9
- Robbery 1
- Drugs/Narcotics 5
Total Person Crimes: 38 (33)
Total Property Crimes: 365 (444)
Total Society Crimes: 35 (61)
Unspecified Crimes: 79 (68)
TOTAL REPORTED CRIMES: 517 (606)
SOUTHAMPTON
Population: 6,647
- Murders 0 Murder rate: 0
- Assaults 35
- Sexual Assaults 1
- Carjackings 1
- Motor Vehicle Theft 78
- Theft FROM Vehicle 37
- Motor Vehicle Theft Parts/Accessories 34
- Burglaries/Breaking & Entering 20
- Property Vandalism 90
- Weapons Violation 6
- Robbery 14
- Drugs/Narcotics 4
Total Person Crimes: 41 (26)
Total Property Crimes: 375 (425)
Total Society Crimes: 34 (26)
Unspecified Crimes: 69 (70)
TOTAL REPORTED CRIMES: 519 (547)
Surveillance Security Cameras for Your Business

Schedule a FREE On-Site Security Evaluation Today!
MO: 314-241-0422 IL: 618-394-1144 or Email Us
St. Louis Neighborhood Crime Map
the NIBRS (National Incident-Based Reporting System) compiles crimes reported by law enforcement agencies neighborhood by neighborhood, from most metropolitan U.S. cities, including St. Louis City and County, and surrounding Illinois cities and municipalities: Belleville, East St. Louis, Collinsville, Fairview Heights, etc. Crime data is submitted to the NIBRS by local, state and federal law enforcement agencies. In this case, the St. Louis Metropolitan Police Department.
The NIBRS is able to pinpoint on a map the exact location of a reported violent and/or nonviolent crime, including armed robberies, murders, vehicle thefts, drug busts, sexual assaults, peeping toms, prostitution, burglaries, drunk and disorderly, disturbing the peace, and many more.
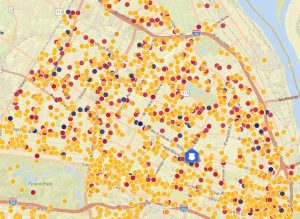
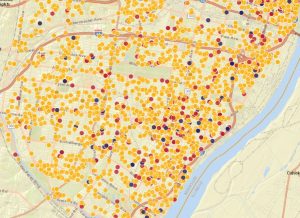
The St. Louis neighborhood crime map, shown below, pinpoints the location and volume of crimes reported in St. Louis City. This example is October thru December 2022. One look at the dense cluster of dots (each representing an individual crime) and it’s no surprise the first ten minutes of every St. Louis TV news broadcast is consumed with shootings, murders, car break-ins, assaults, burglaries, robberies, etc.
What the public sees on TV news reports is only a small percentage of the crimes committed and reported to the police in the City of St. Louis. And remember, only a (undetermined) percentage of crimes are actually reported to the police. So you can imagine what we don’t know about crime in St. Louis.
Since TV news airtime is limited and the station’s crews too small to cover every notable crime, St. Louis TV news stations rely heavily on video surveillance security camera footage supplied by business owners or the city to help tell their stories. The surveillance security camera footage of a crime in progress can be a little disturbing at times. Surveillance footage has shown teenagers dressed in hoodies repeatedly throwing metal trashcans and bricks at Central West End business storefront windows at 3 a.m. Or ramming stolen cars (they’re not so dumb as to use their own cars) right through the front doors of a business, jump out and ransack the place.
One security surveillance video showed as many as eight young thieves parading through a shattered storefront glass door in single file, camouflaged in dark hoodies, as they made their way to the glass merchandise cases in the lobby and then smashed those and stuffed pillow cases with jewelry.
The St. Louis City crime map below is hosted and managed by CITYPROTECT, their link can be found on the St. Louis Metropolitan Police Department website. Its accuracy and detail, when viewed at full scale, can even identify individual streets and the hundred block where the crime took place. Crimes are not populated in real time though and may even lag months behind.
Color Coded St. Louis City Crime Map

Red dots identify serious crimes and violent crimes: physical assaults, homicides, kidnappings, sexual assaults, armed robberies, etc.
Black dots (dark blue here) are minor infractions: disorderly disturbances, drug and liquor related incidents. These are considered “quality of life” incidents.
Yellowish dots are crimes typically against residential and business properties: breaking and entering, acts of vandalism, vehicle thefts and break-ins (smash-and-dash incidents).
See: St. Louis smash-and-dash vehicle crime story.
As you can see, North City neighborhoods show more Red Dots (violent crimes) than other parts of the city, but property crimes are heavy in South City and may even have a slight lead.
St. Louis City’s Resurgence – The Back Story
Although it’s been decades since the City of St. Louis was recognized as a bustling metropolis, its population peaking just north of 800,000 in the robust post-war 1950s but steadily declining ever since and holding steady just below the 300,000 mark in 2022, there has been an infectious, forward-thinking mindset shift over the last two decades resulting in the development of thousands of new residential units and dozens of renovated buildings in downtown and other areas of St. Louis City.
Beginning in the 1990s, builders, developers, investors and business entrepreneurs saw opportunity, real estate gold is more like it, just waiting to be mined from the dozens and dozens of abandoned old brick factories, office buildings and warehouses along Washington Ave., Locust St., Olive St., and throughout many areas of the city. This included the once bustling Garment District north of Trucker Blvd., and the bygone shoe factories left empty and forgotten in the early 2oth Century after St. Louis lost its crown as the world’s reining king of shoe manufacturing.
A Change is Gonna Come
In the mid 90s, along the Washington Avenue-Locust Street corridor, only a handful of retail stores were still struggling and barley hanging on after the dormant, dry decades of the 70s and 80s; a couple cocktail bars and half-empty restaurants, starving artists, photographers, start-up fashion designers, used book stores and the like.
But change was coming. The McGowan Brothers Development company began buying up old factory buildings along Washington Ave. and renovating them into high-end residential lofts and trendy business spaces. More developers followed suit and began doing the same. The remaining artists and fledging small businesses accustomed to paying $3.50 a square foot were faced with rent increases of $9.00 to $16.00 a square foot. For most, this meant the end and they moved on.
But new businesses soon began filling the empty storefronts and new renovated spaces. And it was about this time that visionary Robert Cassilly snatched up the old International Shoe building at 750 N. 16th St., and began transforming it into what would become the hugely popular, and charmingly quirky, City Museum, which now draws hundreds of thousands of visitors each year. And yet, the Washington Ave. club scene was still a full decade away.
Build it and They Will Come
The rebirth of this area of the city didn’t take shape overnight. It took the tireless efforts of dozens of entrepreneurs and visionaries, millions of dollars, and years of back-breaking labor to transform the historic 19th Century buildings into viable business work spaces, upscale multi-family condos, luxury lofts and apartments outfitted with all the modern-day amenities that would, hopefully, begin luring the restless and adventurous “back” into the city.
And it worked! Other city neighborhoods were soon undergoing their own transformations, making room for young, single hipsters and corporate ladder-climbers, childless twenty-somethings, and even doting new parents and old-fart, empty-nesters wanting to stake their claim in the new city-living resurgence. After all, many of their parents grew up in the city when it was still a vibrant metropolis, now they wanted their shot.
Who could resist? The gravitational pull was too overpowering for the adventurous and the restless who were bored with the same-old-same-old, milk-toast lifestyle in the suburbs. They sought adventure and dared to cross the city line to experience a new citified lifestyle where they could live and work just a short walk from new restaurants, pizza joints, white tableclothed eateries, nightclubs, bars, bowling alleys and even enjoy a date night at the new movie theater at Sixth and Washington.
Midtown and South City
Under the vision and leadership of Father Biondi, St. Louis University was also busy buying up old buildings, and they still are, and constructing new ones in St. Louis’ Grand Centre neighborhood in Midtown. Washington University was doing the same in the newly evolving Cortex complex in the Central West End. And on the southside, the Tower Grove South neighborhood was busy attracting trendy new eateries and shops, and even a handful of national brands. New residents were eager to experience what their parents had a generation prior, before they hightailed it to the burbs for sprawling green lawns and new schools. The same was true for Soulard, Benton Park, Cherokee Street, and other city enclaves.
The dream of a resurgence was nothing new to the folks on the near Northside either, who were busy circling the wagons and pooling their resources to establish the new community-oriented North Newstead Association, opening its doors in 1993. And a full decade before their emergence, the upstart nonprofit, Old North St. Louis Restoration Group, was busy promoting the revitalization of the neighborhood surrounding Hyde Park and home to Crown Candy.
St. Louisans were witnessing a rebirth of their often maligned “cow town.” Watching it rise from the ashes much like the mythical Phoenix after decades of neglect and dormancy.
In the immortal words of Dr. Frankenstein as he shouted from his laboratory in astonishment and vindictive pride upon witnessing the resurrection of his monsterly cadaverous creation: “It’s ALIVE!!! It’s ALIVE!!!”
Yes, St. Louis was back on the map.
Make Your School Weapons Free

What Can You do to Protect Your Business and Family?
If your business or home is not properly secured you could be vulnerable to theft, or even physical danger.
Not every business has deep enough pockets for security guards. And security guards can only be in one place at one time. Most are not fully qualified or certified and they can also create legal liability issues. Off-duty cops are obviously reliable resources for added security but they can command as much as $130 an hour for their security services.
And keep this in mind, since a security guard’s eyewitness account of a crime, or anyone’s eyewitness account for that matter, carries less weight and validity in the court of law than actual security video surveillance footage, the best defense against crime is installing a security camera video surveillance system at your business, preferably integrated with LIVE video monitoring so police can be dispatched in real time and catch thieves in the act.
Most security companies do not have this capability, but PASS Security does offer this service.
Security cameras can also be integrated with your access control security system so if an intruder does break into your business, security cameras are automatically triggered.
In light of escalating crime in the St. Louis Metro Area, there is no time like the present to update your business access control system (also called a keyless entry door or card reader security system) at all exterior entryways at your commercial business, the same for multi-family apartment complexes, including St. Louis City lofts and condos.
Taking these security measures seriously is not paranoia, it’s smart and will save thousands in the long run compared to making repairs to your building, resupplying inventory, paying higher insurance premiums, filing and police reports.
It is recommended by the St. Louis Metropolitan Police Department that all St. Louis businesses and homeowners take strict security measures no matter their neighborhood.
Find a Local Security Company You Can Trust
When hiring a security company, be sure to hire a professional and reputable local security company near you, or in your region, whose security specialists and system installers are trained and certified, and whose reputation exceeds your expectations. A top security company will be happy to evaluate your security needs, at no cost, and install a quality security system that is scalable and customized to your needs. Also be sure your security provider performs regular inspections to monitor necessary hardware and software updates as security technology improves and crime trends evolve.
Do right by your family and your business, and hire a local security company that is familiar with St. Louis and surrounding Illinois communities so they know what are the best security measures to put into place.
Contact us today to schedule a FREE SECURITY SYSTEM consultation in the St. Louis Metro Area, Central and Southern Illinois. Call 314-241-0422 or 618-394-1144 or Email Us.
Founded in 1969, PASS Security is headquartered in St. Louis, MO. and Fairview Heights, IL. We are a premiere, local full-service electronic security systems company, providing over 50 years of expertise in intrusion detection alarm systems, video surveillance, access control systems, and LIVE video monitoring for businesses, and large commercial and enterprise operations. PASS Security certified technicians are trusted by thousands of home owners for the installation of the best security systems for homes, and offer a wide range of residential security solutions, from innovative SMART home automatic lighting controls and access control systems for entry doors, doorbell porch cameras, to home smoke detectors, carbon monoxide detectors and outdoor security cameras equipped with motion sensors and night vision capabilities. If 24 – 7 security for your business or home is your priority, PASS Security is your solution. We have consistently been recognized in the St. Louis Metro Area and Illinois as the best local security company since 1969 for commercial and home security camera system installation, and all other security products and services.